
Electric Vehicle Fires: What the Data Sources Tell Us
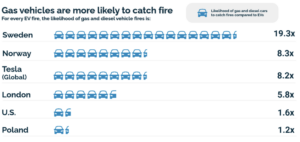
Global data on over 38 million vehicles show EV fires are less frequent than gas car fires
Key Takeaways
- Electric vehicles are less likely to catch fire than gas vehicles. This finding is replicated in six major studies worldwide.
- Electric vehicles present a lower fire risk than gas vehicles: for every 100,000 vehicles, gas car fires were more frequent.
- Further research can investigate the causes of vehicle fires and the relationship between fire incidents and vehicle age. Long-term data is needed to research these topics.
Background and context – Why we chose to research vehicle fires
Persistent misinformation and disinformation about electric vehicle (EV) fire safety continue to appear in the news. Mass-produced EVs are a relatively new technology, and EV fires, though rare, burn differently from the gas-car fires that emergency responders are familiar with. As a result, they provoke strong reactions and garner disproportionate media coverage. Disinformation about EV fires is not only misleading but also leads to very real policy implications that can slow EV adoption. Sensationalized stories of fire incidents have prompted some fire departments and municipalities to restrict or ban EV charging in apartments and parking garages. Some ferry services have banned EVs, eliminating EV access for drivers in remote locations. Because of the media attention paid to EV fires, it is easy to overestimate their likelihood. The solution to EV fire safety lies in responder training, continued improvements in battery technology, and crash-site protocols, paired with current, factual evidence.
Data on the frequency and likelihood of electric vehicle fires are scarce and often outdated. The United States does not currently publish vehicle fire data broken down by drivetrain, although the U.S. Fire Administration has launched a modernized data collection system (National Emergency Response Information System, or NERIS) that is expected to provide more accurate data starting in late 2026. One of the most frequently cited statistics on the likelihood of vehicle fires was published by AutoinsuranceEZ, using data from the National Transportation Safety Board. However, this dataset only includes fires that occur in connection with fatal crashes (a small total number of incidents), and its statistics are outdated. With so much misinformation and disinformation regarding EV fires, there is a need for current, large-scale, and reliable information.
To find out the truth about EV fire safety, Plug In America examined dozens of datasets, research papers, and articles about EV fires. After a comprehensive literature review, we compiled and analyzed six major data sources from four countries, one city, and global data from Tesla to determine the frequency of fires in electric vehicles compared to gas and diesel vehicles.
For each study, we divided the number of fires recorded for electric vehicles, and separately for gas or diesel vehicles, by the number of registered vehicles of that type, then multiplied by 100,000 to get a rate of fires per 100,000 vehicles for each powertrain type.
In every single study, we found that fires in electric vehicles are less likely than fires in gas and diesel vehicles.
Collectively, these studies cover over 30 million gas and diesel vehicles and close to 9 million electric vehicles on the road. They represent the largest-scale and most current data we have on this topic. Most studies cover all types of fire incidents, including those caused by crashes and collisions, electrical faults, arson, and fires spreading from another source. The Highway Loss Data Institute study specifically examined fires not caused by a crash. The study found that non-crash fires in gas and diesel cars were more frequent than non-crash fires in EVs. Other studies have shown that most ‘park outside’ warnings issued by the U.S. National Highway Traffic Safety Administration (NHTSA) that warn drivers of a fire risk from their vehicles have applied to gas vehicles, not EVs.
No research study is perfect, which is why we examined numerous datasets and research papers before reaching our conclusion. We analyzed the data sources and research methodology to identify strengths and weaknesses of each source. In the results provided, we identify the data limitations of each study. Some studies do not account for vehicle age, and we know that older gas vehicles are more likely to catch fire than newer ones. As the EV market matures, the likelihood of fires by vehicle age will require further study. We do know from recent research that EVs are proving to be more durable than gas cars, and that higher-mileage electric vehicles are more reliable than higher-mileage gas cars. However, since electric cars have been on the road for more than a decade, we have strong evidence that they are no more likely to catch fire than gas or diesel vehicles. In fact, EVs are only getting safer, and some emerging battery chemistries pose little to no fire risk.
Our analysis represents the single-largest vehicle fire frequency study. Collectively, the studies we reviewed cover over 30 million gas and diesel vehicles and over 9 million electric vehicles on the road. To calculate the fire rate by drivetrain, we divided the total number of vehicle fires recorded in each study by the number of registered cars of each type. We also examined the different datasets, evaluated their strengths and weaknesses, and noted avenues for further study—including accounting for vehicle age or explicitly denoting the cause of the fire, which some of the studies we reviewed did not explore. Read more about the sources, methodologies, and limitations of each study in the sections below.
Source | Gas and diesel vehicle fires (out of 100,000 vehicles) | Electric vehicle fires (out of 100,000 vehicles) | Higher likelihood of gas or diesel vehicle fires |
Norway | 50 | 6 | ↑ 8.3x |
London | 69 | 12 | ↑ 5.8x |
United States* | 19 | 12 | ↑ 1.6x |
Poland | 42 | 36 | ↑ 1.2x |
Sweden | 77 | 4 | ↑ 19.3x |
Tesla (global) | — | — | ↑ 8.2x |
*Includes non-crash fires only
Note: The definitions, units of measurement, and types of fire incidents included vary for each source. Continue reading for further details.
Data sources
We compiled and analyzed six data sources from around the world in order to provide a more complete picture of vehicle fire likelihood. We chose data sources based on their size, quality, and whether they provided a comparison of the likelihood of EV versus gas/diesel vehicle fires. We also prioritized studies that published data for 2025 to find the most up-to-date information. Data sources on this topic remain scarce, and not every country or automaker publishes vehicle fire data. We will update our data sources as more become available.
Norway (2025)
Key finding: Gas and diesel vehicle fires are more than 8 times more frequent than fires in EVs.
- Gas and diesel cars: 50 fires per 100,000 vehicles
- Traditional hybrid and plug-in hybrid cars: 5 fires per 100,000 vehicles
- All-electric cars: 6 fires per 100,000 vehicles
Data sources: The number of passenger car fires per year by fuel type is from the Directorate for Civil Protection and Emergency Preparedness in Norway. The number of vehicles on the road by fuel type is from Statistics Norway.
Statistics: The data show that in 2025, there were 817 fires in gasoline- and diesel-powered passenger cars, 18 fires in hybrid cars, and 57 fires in all-electric passenger cars. In 2025, there were 1,628,029 registered gas and diesel cars, 370,916 hybrid cars (including plug-in and traditional vehicles), and 948,185 electric cars in Norway.
Methodology: The database does not include information about the source of the fire for each incident. The data also includes fire incidents in which an electric vehicle’s battery did not catch fire. This means the number of electric vehicle fire incidents likely includes arson or fires originating from external sources, rather than those caused by the vehicle itself.
London (2025)
Key finding: Gas and diesel vehicle fires are close to 6.3 times more frequent than all-electric vehicle fires.
- Gas and diesel vehicles: 69 fires per 100,000 vehicles
- Gasoline-powered traditional hybrid and plug-in hybrid vehicles: 21 fires per 100,000 vehicles
- All-electric vehicles: 12 fires per 100,000 vehicles
Data sources: The total number of vehicle fires and the number of electric vehicle fires come from the London Fire Brigade. Data for the number of registered vehicles is from the UK government, filtered for the number of vehicles in the city of London.
Statistics: In 2025, there were 1,517 total vehicle fires, 20 fires in all-electric vehicles, and 64 fires in gas/electric hybrid vehicles in London, which includes plug-in and traditional hybrid vehicles. Subtracting the number of electric and hybrid vehicle fires from the total number of vehicle fires, there were 1,427 fires in gas and diesel vehicles. At the end of 2025, there were 2,058,400 gas and diesel cars, 300,600 gas/electric hybrid cars, and 168,074 all-electric cars in London.
Methodology: Again, this database did not include information on the source of the fire, so fires originating from external sources (such as arson or spreading from another vehicle or building fire) may be included in this data. The number of fires in hybrid vehicles includes both plug-in and traditional hybrid vehicles (without a plug). Although the number of registered vehicles includes only passenger cars, the number of fires includes all road vehicles, so the fire incidence across all passenger vehicle categories is likely to be slightly lower. There are some diesel-electric hybrid vehicles in London, but these vehicles were not included in this analysis.
United States (2012-2026)
Key finding: Non-crash fires in gas vehicles are 1.5 times more likely than non-crash fires in electric vehicles.
- Gas vehicles: 19 fires per 100,000 insured vehicle years
- All-electric vehicles: 12 fires per 100,000 insured vehicle years
Data sources: The Highway Loss Data Institute (HLDI) collects data on vehicle fire losses that do not involve a crash (“non-crash fire events”). These data report the number of insurance claims filed for non-crash fire losses and the exposure of each vehicle type. However, the report only covers a select group of vehicle models that have both an all-electric and a gasoline counterpart for direct comparison (for example, the Volkswagen Golf and E-Golf). The data also includes all Tesla models and gas vehicles that are similar in size and price. The model years of the vehicles range from 2012 to 2026.
Statistics: This report measures exposure in insured vehicle years. One insured vehicle year equals one vehicle insured for one year. For example, one Tesla vehicle insured for 5 years would be counted as 5 insured vehicle years. As of April 2026, there were 9,118,588 all-electric insured vehicle years for those specific models, and 90,704,600 insured vehicle years for their gasoline counterparts. There were 1,090 non-crash fire claims among the all-electric vehicles and 17,070 insurance claims among the gas vehicles.
Methodology: This data is limited to non-crash fires and does not provide supplementary information on the fire’s cause. Using date and location metrics, likely wildfire-related events were excluded from HLDI’s analysis. This dataset only includes vehicles covered by major insurance providers that submit their data to HLDI, excludes hybrids, and is therefore not exhaustive of all possible vehicle models and scenarios.
Poland (2025)
Key finding: Gas and diesel vehicle fires are over 1.15 times more likely than all-electric vehicle fires.
- Gas and diesel vehicles: 42 fires per 100,000 vehicles
- Hybrid vehicles: 8 fires per 100,000 vehicles
- All-electric vehicles: 36 fires per 100,000 vehicles
Data source: Data are from Poland’s State Fire Service, reported by the Polish New Mobility Association.
Statistics: In 2025, there were 44 fires involving all-electric vehicles, 105 fires involving hybrid vehicles, and 9,515 fires involving gas and diesel vehicles. The report does not specify whether ‘hybrid’ includes both traditional hybrids and plug-in hybrids. This report provided the number of vehicle fires and the fire rate, but not the number of registered vehicles in Poland. Dividing the number of fires by the fire rate indicates approximately 22,927,711 gas/diesel vehicles and 121,547 electric vehicles in Poland.
Methodology: The vehicle battery did not catch fire in 77% of reported EV fires. If we exclude the incidents where the battery did not catch fire, there were only about 10 total battery-related EV fires and about 8 fires per 100,000 electric vehicles, making gas/diesel vehicle fires over 5 times more likely. It is not clear whether the number of fires involving gas and diesel vehicles also includes arson and fires that were transferred from another area.
Sweden (2022)
Key finding: Gas and diesel vehicles are close to 20 times more likely to catch fire than electric and hybrid cars.
- Gas, diesel, and ethanol vehicles: 77 fires per 100,000 cars
- All-electric and plug-in hybrid vehicles: 4 fires per 100,000 cars
Data source: A 2023 report from the Swedish Civil Contingencies Agency.
Statistics: The agency reported the total numbers of registered electric and gas/diesel cars, and of EV fires, from 2018 to 2022. The data also included the average annual number of vehicle fires. Our analysis examined 2022 data, which indicated that Sweden had 4,369,827 gas, diesel, and ethanol vehicles, 197,709 all-electric vehicles, and 413,007 plug-in hybrid vehicles, for a total of 610,716 electric vehicles on the road.
Methodology: The most recent data source is four years old, making the report somewhat outdated. All-electric vehicles and plug-in hybrids are grouped together, making it difficult to determine how many fires started in electric batteries. The report specifies which area of the vehicle the fire started in (front, side, etc.), but does not list the cause of each fire, so it is impossible to exclude fires that did not start in the vehicle’s battery.
Tesla (global, 2012-2024)
Key finding: Tesla vehicles catch fire over 8 times less frequently than an average U.S. vehicle.
- All vehicles: 1 vehicle fire for every 17 million miles traveled
- All-electric vehicles (Tesla): 1 vehicle fire for every 140 million miles traveled
Data source: The data are from Tesla’s Vehicle Fire Data report.
Statistics: Tesla collects global fire event data involving its vehicles through vehicle telemetry, customer service, media reports, and other sources. Tesla’s annual vehicle fire data is collected a year before publication, making 2024 the most recent published report. Tesla also publishes the number of miles driven before a fire event, expressed in millions of miles, and the automaker compares their metrics to the U.S. average number of miles driven before a fire event (sourced from the National Fire Protection Association (NFPA) and the U.S. Department of Transportation). U.S. government data does not include the total number of Tesla vehicles on the road, but other estimates report that there were close to 7 million Tesla vehicles at the end of 2024.
Methodology: Tesla does not publish the raw number of vehicle fires, making its metric difficult to compare with other sources. The data include fires caused by wildfires, arson, structure fires, and other causes unrelated to the vehicle, whereas the NFPA data exclude these fire incidents. Taking the cause of the fire into account suggests that Tesla vehicles are even less likely to experience a fire event originating from the vehicle than the average U.S. vehicle.
Other EV Fire Safety Resources
Check out other fire safety resources on our blog and in our EV Policy Hub.
Written by Jess Senger, Senior Policy Research Associate, and edited by Ingrid Malmgren, Senior Policy Director. Last updated: Oct. 27, 2026.


